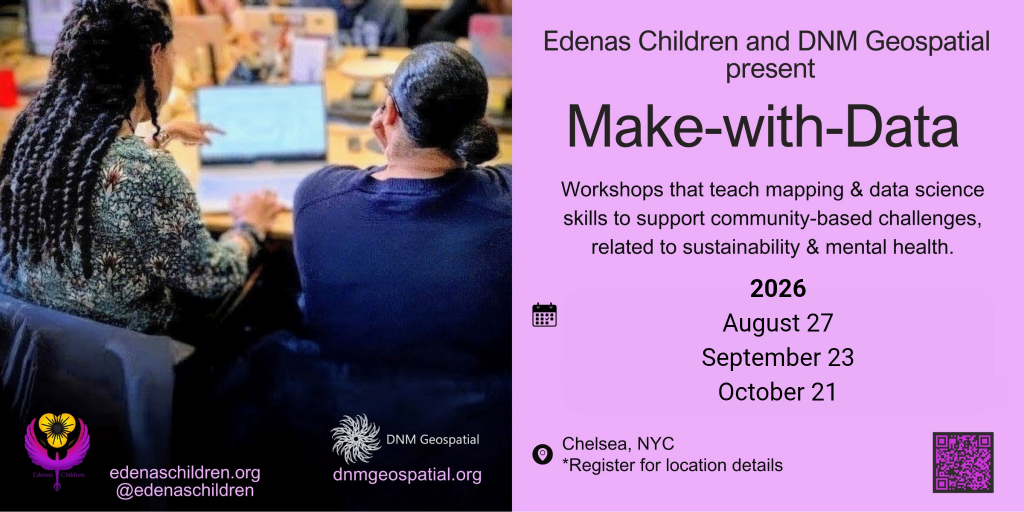
Make-With-Data supports the research of community-based challenges, primarily related to local conservation, sustainability, and mental health.
The workshops are full of activities that align real world challenges with data sources and scientific methods to explore solutions that simultaneously teach important mapping and data science skills.
We explore patterns in mental health data and address questions such as where are people experiencing depression? What does access to mental health support look like? Are mental health conditions (anxiety, depression, ADHD, schizophrenia, etc.) related to socioeconomic and environmental variables?
See more at our GitHub here: https://github.com/edenaschildren/make-with-data
See our events at our Eventbrite here: https://www.eventbrite.com/o/edenas-children-115902379921
- Make-With-Data: Mapping Mental Health Recap!
From October 2025 to March 2026, Make-With-Data: Mapping Mental Health hosted 6 in-person workshop events that raised awareness about the state of Mental Health in NYC and how it correlates with environmental, socioeconomic and demographic variables.
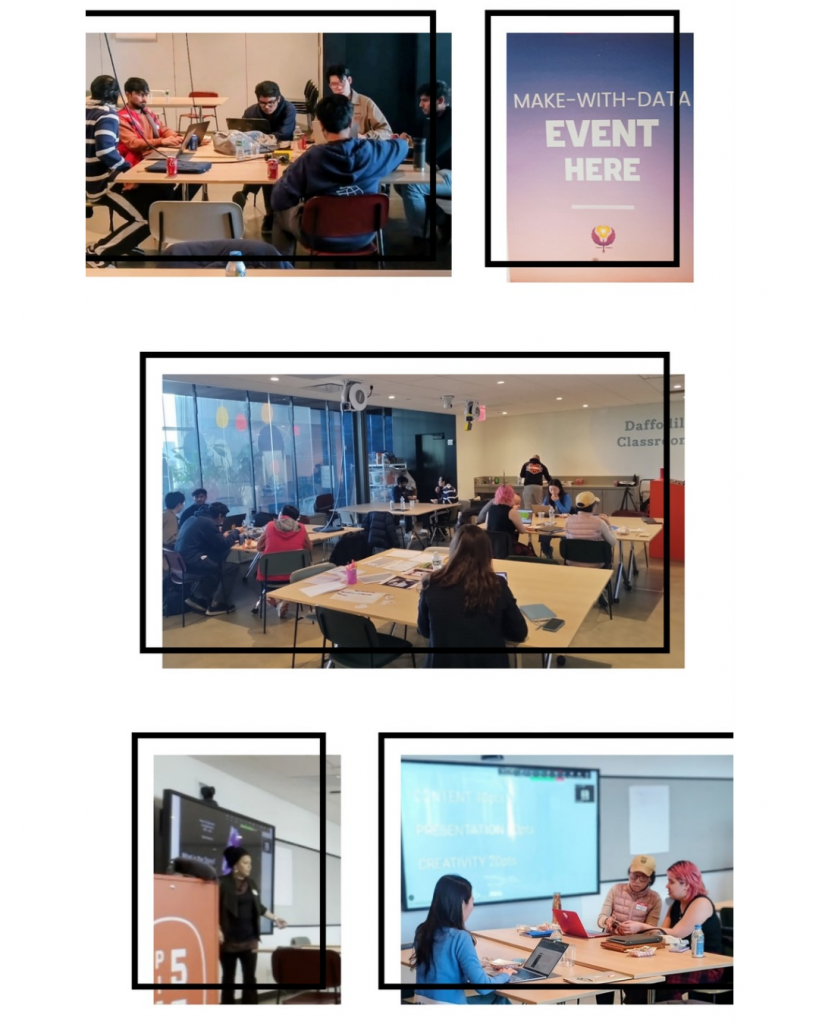
We reached over 2500 people and taught 200+ participants how to use important mapping and data science skills to explore patterns of Depression in NYC from select years between 2017-2022.
In March, the workshop series culminated with our premiere Hackathon to engage the community to make maps and tell stories with the data.
We had 62 participants, 3 expert judges, and 5 prize winners
First place Make-With-Data Hackathon winner, found that the average age-adjusted percent of people with Depression by neighborhood across NYC, increased 3.2% in 2021-2022 to 13.3% from it’s 10.1% in 2017-2018. They used a variety of statistical methods to show “Depression Rising: NYC Before & After the Pandemic”
Second place Make-With-Data Hackathon winner, explored distribution of neighborhoods with the most reports of Depression in 2021-2022 and found Fresh Meadows in Queens to be the highest at 19.7% followed by Crotona-Tremont in the Bronx with 19.0%.
Third Make-With-Data Hackathon winner, mapped neighborhood Depression and race. They used visual analysis to suggest that there may be a positive correlate between areas of Depression with more dense areas of Hispanic and Black populations.
Fourth place Make-With-Data Hackathon winner, explored the relationship of Depression and the Heat Vulnerability Index, and found that neighborhoods with higher percent of Depression may also have areas with high heat vulnerability.
Make-With-Data is not just mapping or visualizing information, its making sense of it all, creating and sharing knowledge, telling a story.
To learn more about the maps and stories, check out our Make-With-Data GitHub page and Hackathon for Make-With-Data GitHub Repo page.
Join us for the next workshop on August 27th, register at Eventbrite.
The next Make-With-Data Hackathon will bee on October 21st, register at Eventbrite.
Thanks to @dnmgeospatial, @drascalhat and the @edenaschilden volunteers!
Peace, Love and Light